Liberation Day tariffs threaten to disrupt US wind and solar industries
Our experts unpack how the new tariffs are sparking turbulence in US clean energy - raising costs, straining supply chains and casting uncertainty over future wind and solar projects
4 minute read
Endri Lico
Principal Analyst, Global Wind Supply Chain and Technology

Endri Lico
Principal Analyst, Global Wind Supply Chain and Technology
Latest articles by Endri
-
Opinion
Liberation Day tariffs threaten to disrupt US wind and solar industries
-
Opinion
New frontiers: order intake by Chinese wind turbine OEMs advanced beyond domestic dominance in H1 2024
-
Opinion
Wind from the east gathering strength: the outlook for OEMs
-
Opinion
Wind turbine technology evolution is diverging quickly between China and the rest of the world
-
Opinion
Western wind turbine manufacturers are prioritising profit over volume, opening the door for Chinese market share growth
-
Opinion
Goldwind captures the top spot for global wind turbine supply
Sagar Chopra
Senior Research Analyst, Solar

Sagar Chopra
Senior Research Analyst, Solar
Sagar focuses on PV system pricing for US and LATAM regions.
Latest articles by Sagar
-
Opinion
Liberation Day tariffs threaten to disrupt US wind and solar industries
-
Opinion
Supply shortages and an inflexible market give rise to high power transformer lead times
-
Opinion
Top 10 solar PV inverter vendors cornered 86% of the market in 2022
-
Featured
Brighter skies for US solar in 2023? | 2023 outlook
-
Opinion
Is the end of high US solar system prices in sight?
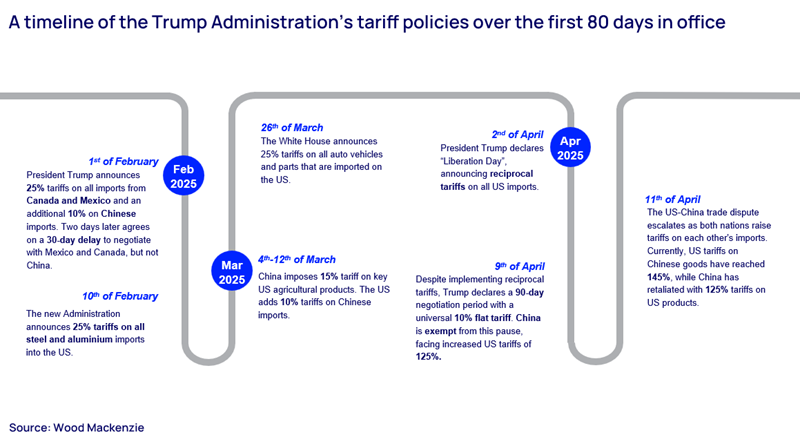
On 2nd April 2025, dubbed ‘Liberation Day’ by the President, the Trump administration announced comprehensive tariffs targeting the global economy. This aims to address the perceived trade deficit with specific countries through ‘discounted reciprocal tariffs’, set at half the value of the trade imbalance on goods divided by how much the US imports from these nations. The EU, along with 59 other nations, face country-specific rates, while most other target countries incur a 10% base tariff rate for imports.
The 10% base duties took effect on 5 April 2025 (and apply to all countries), while the discounted reciprocal tariffs, which were to be implemented on 9 April 2025, have been put on a 90-day pause, except for China, where the tariff rate is now 245%.
Fill out the form at the top of the page to download a few detailed graphs, figures and extracts from our recent reports on the impact of the reciprocal tariffs on US solar and wind, and read on for just a few of our key takeaways.
Reciprocal tariffs: the impact on US solar
US President Donald Trump’s latest 'Liberation Day' tariffs threaten to disrupt the US solar industry, potentially impacting its growth in several ways. These new reciprocal tariffs, introduced in April 2025, range from 10% to 125% and are in addition to existing duties that will reshape the solar supply chain landscape.
The module market, already adjusting to recent anti-dumping and countervailing duties (AD/CVD) cases, is seeing a shift away from traditional manufacturing hubs in Southeast Asia. US domestic manufacturing capacity has grown substantially but still lacks upstream capabilities. Because of the new reciprocal tariffs, Wood Mackenzie expects module prices to increase by up to 15% for US-made modules and 32% for imported Southeast Asian modules.
The inverter market shows a stark contrast between residential and utility-scale segments. Residential inverter manufacturers have largely onshored production, insulating them from tariff impacts. However, the utility-scale segment remains heavily reliant on imports, making it vulnerable to price increases of up to 30%.
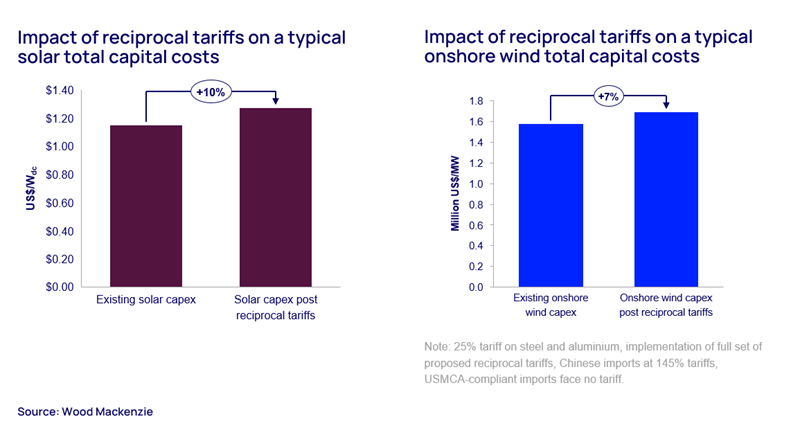
Overall, these tariffs are expected to push US utility-scale solar project costs up by 10%, primarily driven by about 30% jump in module and inverter costs. This shift will likely accelerate domestic manufacturing but may also introduce short-term supply constraints and price volatility. Overseas capacity, deemed to serve the US solar market may become uneconomic due to current tariff rates and create a supply crunch.
In addition to these price increases, which are a direct result of the reciprocal tariffs, domestic and international suppliers to the US market may increase their prices even further if their competitors have been hit harder by the tariffs.
As the industry adapts to this new landscape, manufacturers' strategies in the coming months will be crucial in determining their competitive positions in the rapidly evolving US solar market.
For more details on the impact of the tariffs on US solar, including graphs showing US module imports by country of origin and the effect of liberation day tariffs on average US utility-scale system cost, fill out the form at the top of the page.
Reciprocal tariffs threaten to increase US onshore wind costs by 7%
The recent tariff policies announced by the Trump administration could also have significant impacts on the US wind industry, potentially increasing onshore wind capital expenditures by 1-9% and subsidised levelised cost of energy (LCOE) by 2-11% under various scenarios.
The most impactful scenario would be tariffs on Mexico that include rescinding USMCA exclusions, as nearly half of wind turbine blades for US projects are imported from Mexico.
While wind's competitive position may improve relative to solar and storage in some scenarios, as those industries are more dependent on imports, the tariffs introduce new uncertainties and risks that must be factored into project costs and power purchase agreements. The strong existing order backlog provides some cushion in the near-term, but ongoing uncertainty is making developers hesitant to commit to new orders.
Rather than spurring new domestic manufacturing, the primary risk is a potential slowdown at existing US wind manufacturing facilities if demand weakens. The US wind supply chain is already relatively mature, with high utilisation rates at existing factories. A drop in demand could lead to layoffs or even factory closures. New investments in US manufacturing capacity seem unlikely given the current demand outlook and policy uncertainty.
The tariffs are expected to have both direct and indirect cost impacts. Direct impacts include increased input costs, while indirect effects stem from disruptions to supply-demand balances in complex global supply chains. For example, US hot-rolled coil steel prices have risen 40% in Q1 2025 despite only a 25% tariff, as domestic producers have been able to raise prices.
Wind turbine components most affected by retaliatory tariffs include generators, gearboxes and power electronics. Blades, primarily imported from Mexico, appear to be temporarily shielded from these tariffs as they meet USMCA (United States-Mexico-Canada Agreement) standards. Towers and nacelle assembly have the highest levels of domestic production and thus are also largely shielded from the tariffs. Due to ongoing trade disputes, the wind energy sector has already substantially decreased its dependence on Chinese suppliers.
Overall, the tariffs create significant uncertainty for the US wind industry outlook. While the near-term project pipeline remains strong, the increased costs and risks may slow development of new projects if the policies persist. Careful supply chain and risk management strategies will be crucial for developers and manufacturers to navigate this challenging policy environment.
Learn more
Fill out the form at the top of the page to download more detailed graphs, figures and extracts from our latest solar and wind reciprocal tariff insights.


