Carbon benchmarking study reveals a tale of two segments
Research into some of the world’s largest oil and gas companies compares carbon emissions from upstream and downstream assets – and the associated financial risk
1 minute read
Gavin Law
Senior Vice President, Emissions & Low Carbon Fuels Consulting

Gavin Law
Senior Vice President, Emissions & Low Carbon Fuels Consulting
Latest articles by Gavin
-
Opinion
Is natural gas more emissions intensive than coal?
-
Opinion
Emissions intensity: portfolio composition is the key
The oil and gas industry, like the rest of the industrial world, is preparing for a lower carbon future. Progress has been made, but there’s significant scope to do more and a clear need to accelerate to meet the commitments of the Paris Agreement.
In 2017, we released the inaugural edition of a multi-client study that explored carbon emissions and financial risk associated with the upstream portfolios of 25 of the largest international oil and gas companies. That report found that carbon emissions were expected to grow faster than production. Primarily because some of the biggest growth themes for the industry, such as LNG, oil sands and heavy oil, were also some of the most emissions intensive.
Two years on, we have refreshed our analysis and expanded the coverage to downstream assets to create a comprehensive view of corporate emissions.
So, what does this new dataset reveal?
Emissions intensity varies by region
Emissions intensity is a key metric. While absolute emissions are important, it’s logical that the biggest producers of oil and gas will have the largest absolute emissions. To provide a fair benchmark it’s vital to compare emissions on a per unit of production basis. Even assets of the same theme can have significantly different emissions intensity based on factors including maturity and location.
Our study shows a variation in emissions intensity between upstream and downstream operations on a regional basis. This reflects both the differences in upstream resource themes prevalent in each region, and the complexity of the refining operations.
For instance, Europe has some of the least emissions-intensive upstream operations in the world. This can be attributed to the dominance of the offshore industry and the influence of carbon regulations, particularly in Norway. At the same time, Europe is home to some of the world’s most complex refineries. As a result, emissions intensities of downstream operations in Europe are 34% higher than their upstream operations for the companies in our study.
North America has the highest value at risk from carbon pricing
North America not only has the highest concentration of both assets and emissions in aggregate, these assets are also some of the most valuable in our study. Moreover, North America ranks highly on our study’s policy risk index. The region is second only to Europe in terms of the expected stringency of carbon regulations.
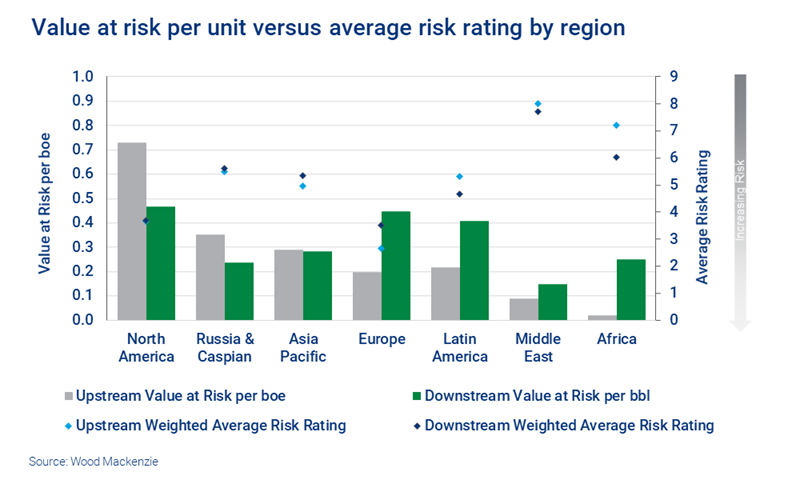
As a result, North America has the highest value at risk from carbon pricing, whether on an absolute or unit basis. On average, a US$40/tonne carbon cost would reduce the value of their upstream operations in the region by ~US$0.75/boe, and downstream operations by ~US$0.40/bbl.
The value at risk per unit of upstream production in North America is twice that of the region with the next highest value at risk – Russia and the Caspian. On the downstream side, Europe ranks a close second to North America in terms of value at risk per barrel of throughput. Europe also has a greater absolute value at risk, given the higher concentration of refining capacity.
Downstream operations have a slightly lower value at risk per unit
Across all operations and regions, more than US$100 billion in value could be eroded if a carbon cost of US$40/tonne were applied. Upstream operations represent ~US$80 billion of that sum, while downstream operations add US$27 billion.
Overall, downstream operations have a slightly lower value at risk per unit than upstream operations. Refining assets tend to be more concentrated in regional hubs, whereas upstream assets are more distributed, based on the resource potential of different countries. Relative risk varies by region, so the two sets of operations have different risk exposure.
In general, there appears to be little relationship between the relative value at risk and the policy risk rating. Resource theme, asset maturity and refinery complexity play a greater role in determining the value at risk from carbon pricing. The mechanisms to reduce exposure will differ by asset type.
What’s inside the full carbon study?
The full study consists of three elements:
- Emissions benchmarking tool: an interactive tool to explore upstream and downstream emissions by geography, company, asset type or source.
- Oil and Gas Carbon Risk Index: a proprietary index that assesses the likelihood and potential impact of climate regulation on the oil and gas sector in more than 80 countries.
- Corporate portfolio and strategy assessment: a report on how the emissions and risk exposure of some of the world’s largest oil and gas companies compares, from 2018 to 2027.
Fill in the form at the top of this page to get a complimentary extract of the report’s key findings.
Get in touch
Whether you’re interested in comparing your own carbon emissions to those of your peers, looking for carbon-related intelligence to inform your emissions strategy, or are curious about the risks to your investment portfolio containing companies with upstream and downstream assets, we are here to help.

Gavin Law, Head of Gas, LNG & Carbon Consulting


